US parents’ and caregivers’ perceptions of school meals programs and ultraprocessed foods (UPFs)
Survey conducted in June 2025
CSPI commissioned a survey in June 2025 to a sample of parents of school-aged children. The survey aimed to gather insights from respondents about participation in, perceptions of, and priorities for the National School Lunch and School Breakfast Programs.
Methods
Big Village’s CARAVAN U.S. Online Omnibus Survey was administered June 3–11, 2025 to a nationally representative sample of adults demographically balanced to the U.S. Census on age, sex, region, race, and ethnicity. Within that survey, respondents who indicated their role as a parent or guardian to at least one child under the age of 17 years living in their home were asked a set of questions regarding school meals programs. Therefore, survey respondents may not be representative of national demographic patterns. In total, 1,513 adults who identified as parents or guardians of children ages 5 to 17 years were included in the sample. The survey aimed to gather insights from respondents about participation in, perceptions of, and priorities for the National School Lunch and School Breakfast Programs. The survey explored opinions on the healthfulness of school meals, knowledge about consumption patterns, and the importance of various meal qualities such as cultural relevance, sustainability, and affordability. It also assessed knowledge of school meal costs and federal nutrition standards, perceptions of ultraprocessed foods (UPFs), and support for policies such as banning harmful additives and providing free meals to all students.
Results by survey question
C1 Does at least one of your children participate in the National School Lunch Program and/or School Breakfast Program? Often called ‘school meal programs’,’ these provide balanced meals to students in participating schools. Meals may be purchased by students at full price, reduced price, or free, based on household income and state policies. [Select one answer]
- Yes
- No
- Not sure
| Child participates in school meals programs? | ||||
| Total | Yes | No or Not Sure | ||
| Overall | 1,513 (100%) | 992 (66%) | 521 (34%) | |
| Parent Age (y) | 18–29 | 150 (10%) | 108 (72%) | 42 (28%) |
| 30–44 | 837 (55%) | 564 (67%) | 273 (33%) | |
| 45+ | 526 (35%) | 320 (61%) | 206 (39%) | |
| Race or Ethnicitya | Non-Hispanic White | 997 (66%) | 630 (63%) | 367 (37%) |
| Non-Hispanic Black | 225 (15%) | 157 (70%) | 68 (30%) | |
| Hispanic (Any Race) | 171 (11%) | 130 (76%) | 41 (24%) | |
| Income | <$50,000 | 563 (37%) | 431 (77%) | 132 (23%) |
| $50,000–99,999 | 515 (34%) | 323 (63%) | 192 (37%) | |
| ≥$100,000 | 435 (29%) | 238 (55%) | 197 (45%) | |
| Parent Gender | Male | 757 (50%) | 488 (64%) | 269 (36%) |
| Female | 750 (50%) | 500 (67%) | 250 (33%) | |
| Age of Child (y)b | 5–11 | 1,039 (69%) | 702 (68%) | 337 (32%) |
| 12–17 | 803 (53%) | 524 (65%) | 279 (35%) | |
| Parent Education | High school or less | 386 (26%) | 282 (73%) | 104 (27%) |
| Some college | 535 (35%) | 352 (66%) | 183 (34%) | |
| College graduate | 592 (39%) | 358 (60%) | 234 (40%) | |
| Parent Employment Status | Employed | 1,142 (75%) | 743 (65%) | 399 (35%) |
| Retired | 41 (3%) | 28 (68%) | 13 (32%) | |
| All Others | 330 (22%) | 221 (67%) | 109 (33%) | |
| Parent Political Affiliationc | Republican | 664 (44%) | 425 (64%) | 239 (36%) |
| Independent | 175 (12%) | 115 (66%) | 60 (34%) | |
| Democrat | 504 (33%) | 345 (68%) | 159 (32%) | |
| All others | 170 (11%) | 107 (11%) | 63 (37%) | |
| Region | Northeast | 283 (19%) | 198 (70%) | 85 (30%) |
| Midwest | 325 (21%) | 214 (66%) | 111 (34%) | |
| South | 517 (34%) | 317 (61%) | 200 (39%) | |
| West | 388 (26%) | 263 (68%) | 125 (32%) | |
| Type of Community | Urban | 497 (33%) | 351 (71%) | 146 (29%) |
| Suburban | 665 (44%) | 406 (61%) | 259 (39%) | |
| Rural | 351 (23%) | 235 (67%) | 116 (33%) | |
a Certain groups, such as other Racial or Ethnic groups and Gender Non-Conforming individuals are not reported due to small sample size. b 329 respondents reported having children in both age groups. c All others include individuals who align with another political party, are unsure, or declined to answer.
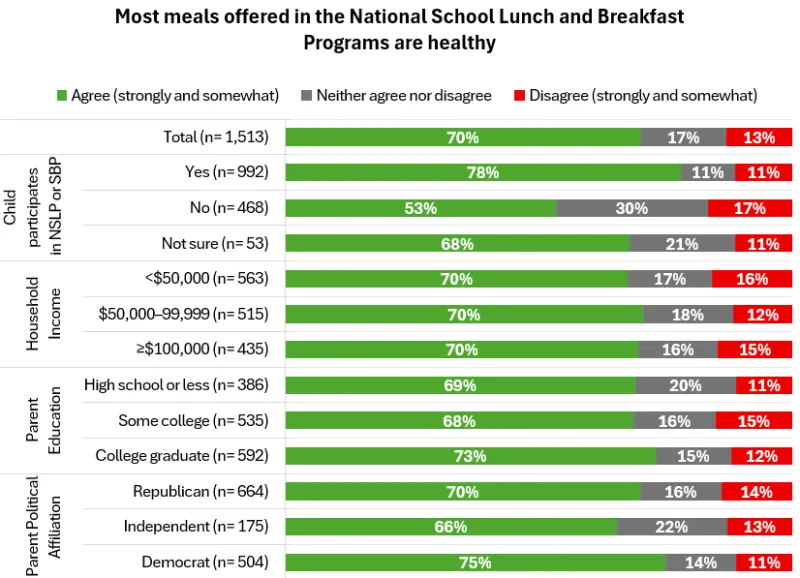
C2 How much do you agree or disagree with the following statement?
Most meals offered in the National School Lunch and Breakfast Programs are healthy. [Select one answer]
1. Strongly agree
2. Somewhat agree
3. Neither agree nor disagree
4. Somewhat disagree
5. Strongly disagree
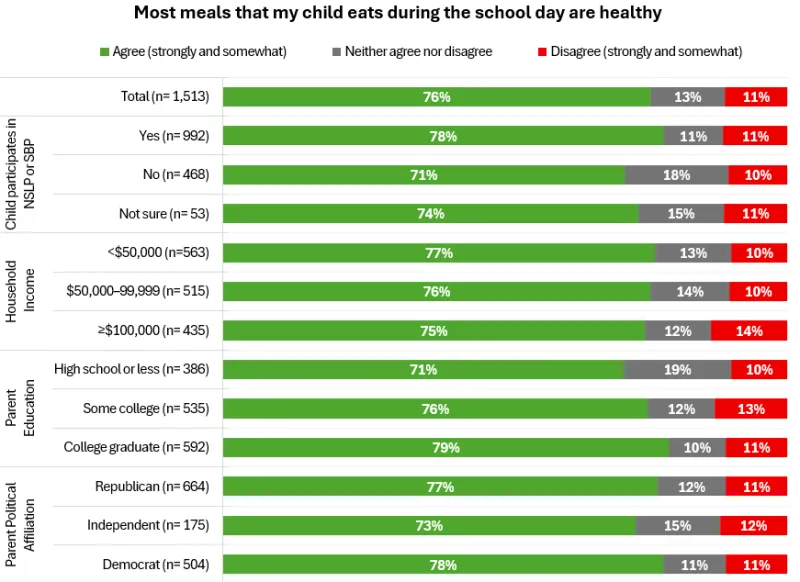
C3 How much do you agree or disagree with the following statement?
Most meals that my child eats during the school day are healthy. [Select one answer]
1. Strongly agree
2. Somewhat agree
3. Neither agree nor disagree
4. Somewhat disagree
5. Strongly disagree
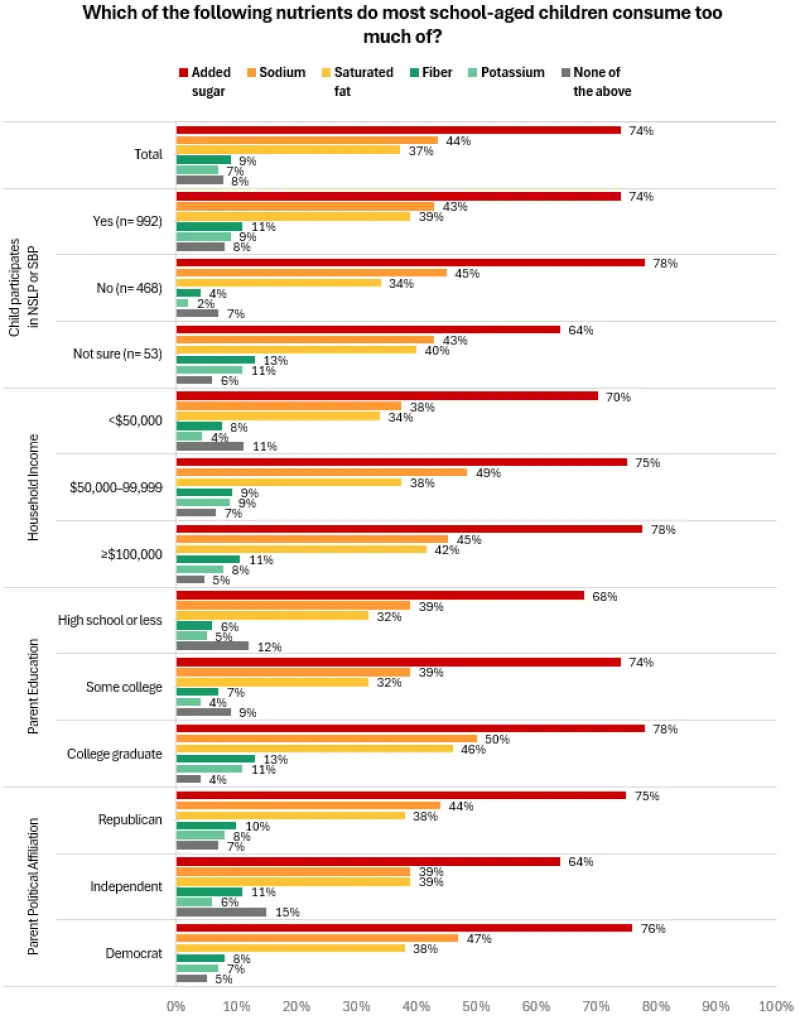
C4 Which of the following nutrients do most school-aged children consume too much of? [Select as many as apply for 01-05. Randomize 01-05]
1. Sodium
2. Added sugar
3. Saturated fat
4. Potassium
5. Fiber
6. None of the above [EXCLUSIVE]
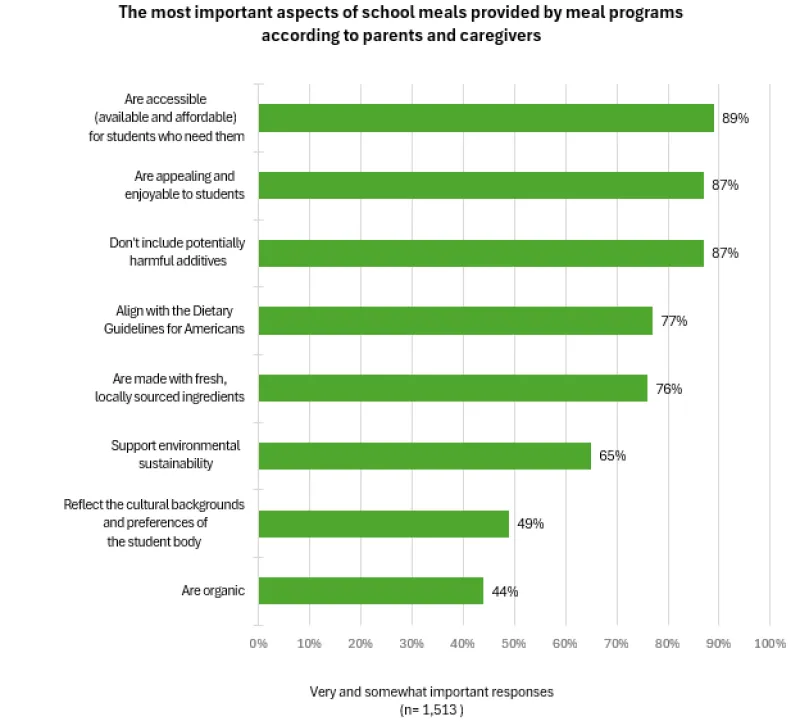
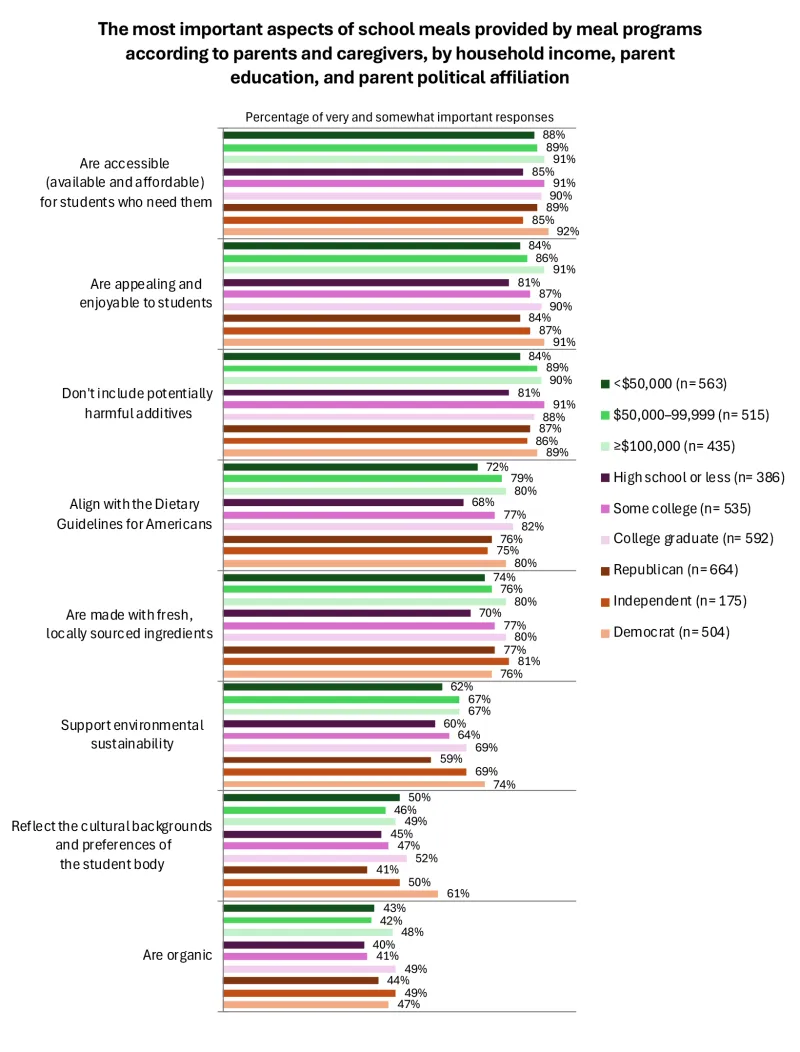
C5 Please rate how important each of the following aspects of school meals provided by school meal programs is to you. [Select one answer for each. Randomize A-H]
| Not at all important | Not very important | Neutral | Somewhat important | Very important | |
| A. Align with the Dietary Guidelines for Americans | |||||
| B. Are made with fresh, locally sourced ingredients | |||||
| C. Reflect the cultural backgrounds and preferences of the student body | |||||
| D. Are appealing and enjoyable to students | |||||
| E. Support environmental sustainability (e.g., reduced food waste, eco-friendly packaging) | |||||
| F. Don’t include potentially harmful additives | |||||
| G. Are organic | |||||
| H. Are accessible (available and affordable) for students who need them |
C6 Please rank the following aspects of school meals in order of importance to you, with ‘1’ being the most important and ‘8’ being the least important.
Please drag and drop the most important aspect of school meals first, the second-most important aspect second, and so on until all aspects have been ranked. [Please drag and drop each option from 1-8. Programming note: Randomize A-H in same order as C5. Range is 1-8. Each number can be used only once]
A. Align with the Dietary Guidelines for Americans
B. Are made with fresh, locally sourced ingredients
C. Reflect the cultural backgrounds and preferences of the student body
D. Are appealing and enjoyable to students
E. Support environmental sustainability (e.g., reduced food waste, eco-friendly packaging)
F. Don’t include potentially harmful additives
G. Are organic
H. Are accessible (available and affordable) for students who need them
| Rank of importance | Priorities for school meals |
| 1st | Are accessible (available and affordable) for students who need them |
| 2nd | Don't include potentially harmful additives |
| 3rd | Are appealing and enjoyable to students |
| 4th | Are made with fresh, locally sourced ingredients |
| 5th | Align with the Dietary Guidelines for Americans |
| 6th * | Support environmental sustainability (e.g., reduced food waste, eco-friendly packaging) |
| 7th * | Are organic |
| 8th | Reflect the cultural backgrounds and preferences of the student body |
*Indicates priorities with the same average ranking.
| Rank of importance by household income | Priorities for school meals | ||
| <$50,000 | $50,000–99,999 | ≥$100,000 | |
| 1st | 1st | 1st | Are accessible (available and affordable) for students who need them |
| 2nd | 2nd | 2nd | Don't include potentially harmful additives |
| 3rd | 3rd | 3rd | Are appealing and enjoyable to students |
| 4th | 4th * | 5th | Are made with fresh, locally sourced ingredients |
| 5th | 5th * | 4th | Align with the Dietary Guidelines for Americans |
| 6th | 7th | 7th | Support environmental sustainability (e.g., reduced food waste, eco-friendly packaging) |
| 7th | 6th | 6th | Are organic |
| 8th | 8th | 8th | Reflect the cultural backgrounds and preferences of the student body |
*Indicates priorities with the same average ranking.
| Rank of importance by parent education | Priorities for school meals | ||
| High school or less | Some college | College graduate | |
| 1st | 1st | 1st | Are accessible (available and affordable) for students who need them |
| 2nd | 2nd | 2nd | Don't include potentially harmful additives |
| 4th | 3rd | 3rd | Are appealing and enjoyable to students |
| 3rd | 5th | 5th | Are made with fresh, locally sourced ingredients |
| 5th | 4th | 4th | Align with the Dietary Guidelines for Americans |
| 6th | 6th | 7th | Support environmental sustainability (e.g., reduced food waste, eco-friendly packaging) |
| 7th | 7th | 6th | Are organic |
| 8th | 8th | 8th | Reflect the cultural backgrounds and preferences of the student body |
| Rank of importance by parent political affiliation | Priorities for school meals | ||
| Republican | Independent | Democrat | |
| 1st | 1st | 1st | Are accessible (available and affordable) for students who need them |
| 2nd | 2nd | 2nd | Don't include potentially harmful additives |
| 3rd | 4th | 3rd | Are appealing and enjoyable to students |
| 4th | 3rd | 4th * | Are made with fresh, locally sourced ingredients |
| 5th | 5th | 5th * | Align with the Dietary Guidelines for Americans |
| 7th | 6th | 6th | Support environmental sustainability (e.g., reduced food waste, eco-friendly packaging) |
| 6th | 7th | 7th | Are organic |
| 8th | 8th | 8th | Reflect the cultural backgrounds and preferences of the student body |
*Indicates priorities with the same average ranking.
The goal of this next set of questions is to understand the public’s knowledge of National School Lunch Program operations and standards.
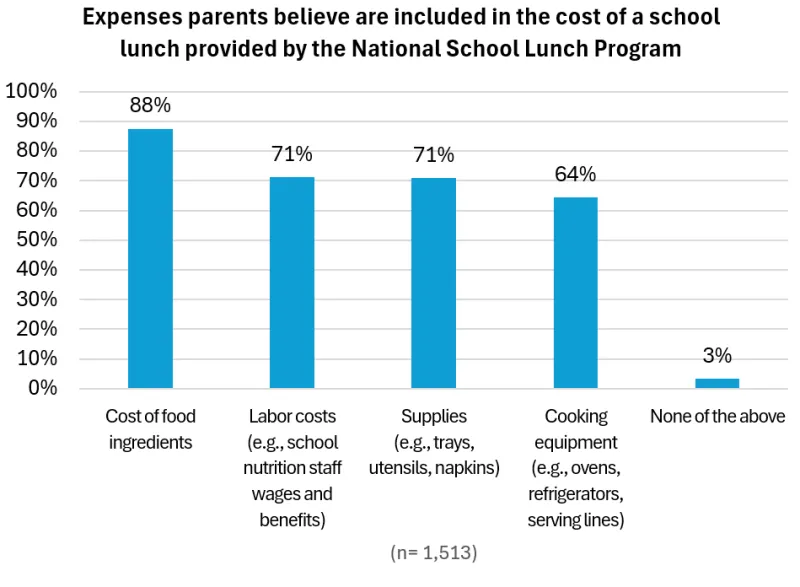
C7 What goes into the cost of a school lunch provided by the National School Lunch Program? [Select as many as apply for 01-04. Randomize 01-04]
1. Cost of food ingredients
2. Labor costs (e.g., school nutrition staff wages and benefits)
3. Supplies (e.g., trays, utensils, napkins)
4. Cooking equipment (e.g., ovens, refrigerators, serving lines)
5. None of the above [EXCLUSIVE]
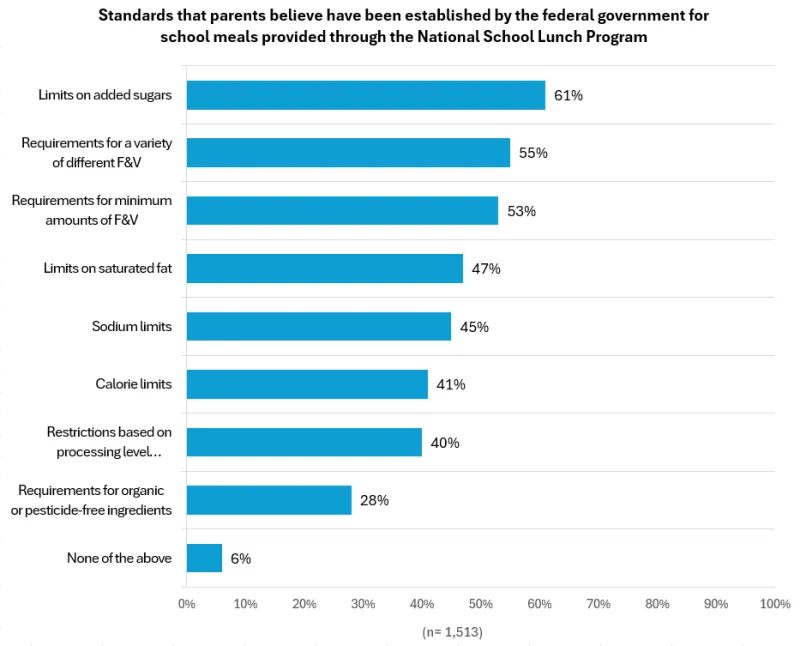
C8 Which of the following are standards that have been established by the federal government for school meals provided through the National School Lunch Program? [Select as many as apply for 01-08. Randomize 01-08]
1. Calorie limits
2. Sodium limits
3. Limits on added sugars
4. Limits on saturated fat
5. Requirements for a variety of different fruits and vegetables
6. Requirements for minimum amounts of fruits and vegetables
7. Restrictions based on processing level (e.g., restrictions on ultra-processed foods)
8. Requirements for organic or pesticide-free ingredients
9. None of the above [EXCLUSIVE]
The goal of the following questions is to understand the public’s perceptions, associations, and opinions about ultra-processed foods and their role in school meals.
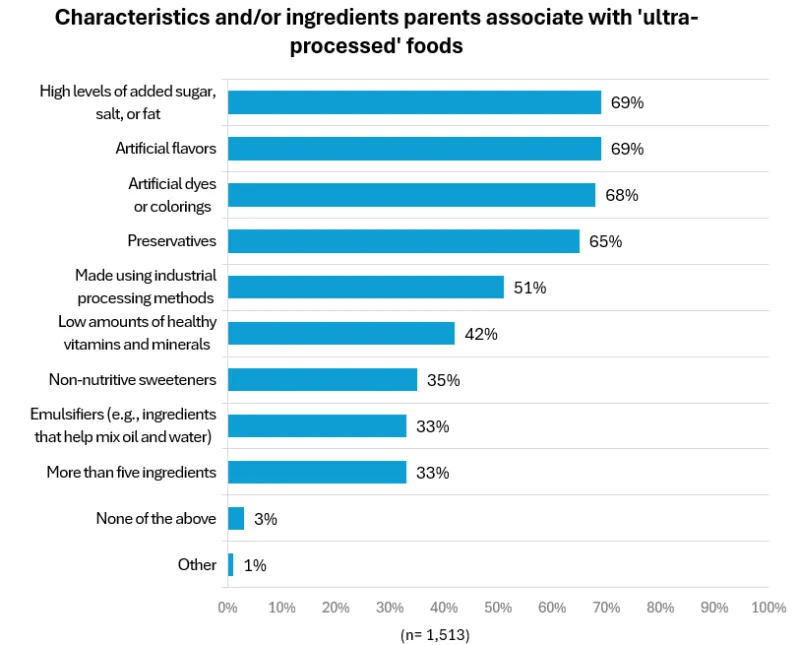
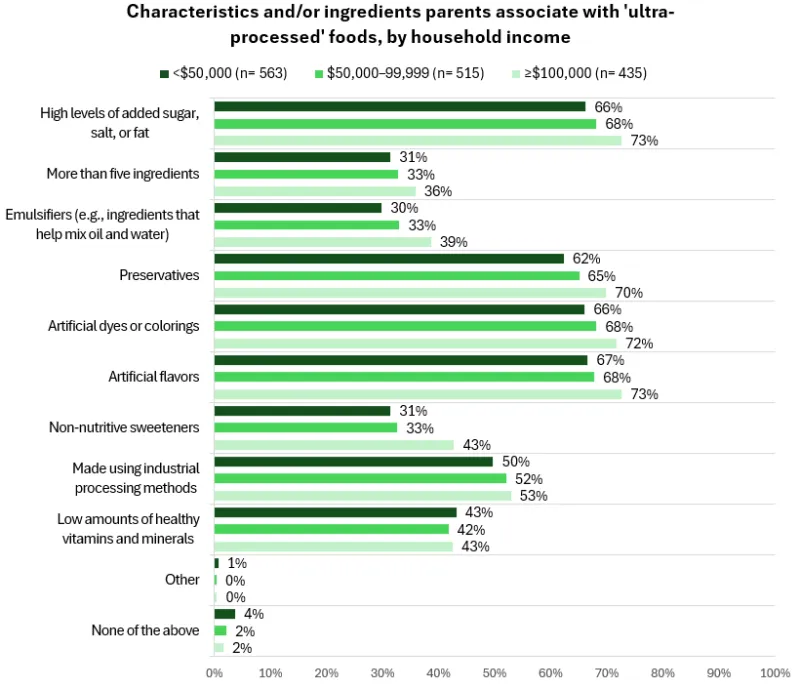
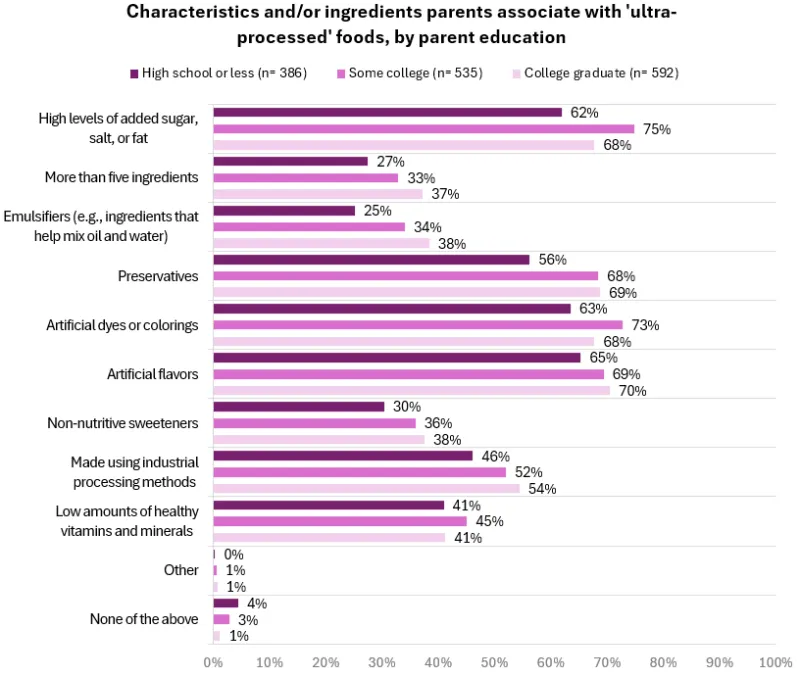
C9 Which of the following characteristics and/or ingredients do you associate with ‘ultra-processed’ foods? [Select as many as apply for 01-10. Randomize 01-09]
1. High levels of added sugar, salt, or fat
2. More than five ingredients
3. Emulsifiers (e.g., ingredients that help mix oil and water)
4. Preservatives
5. Artificial dyes or colorings
6. Artificial flavors
7. Non-nutritive sweeteners
8. Made using industrial processing methods
9. Low amounts of healthy vitamins and minerals
10. Other [Please specify]
11. None of the above [EXCLUSIVE]

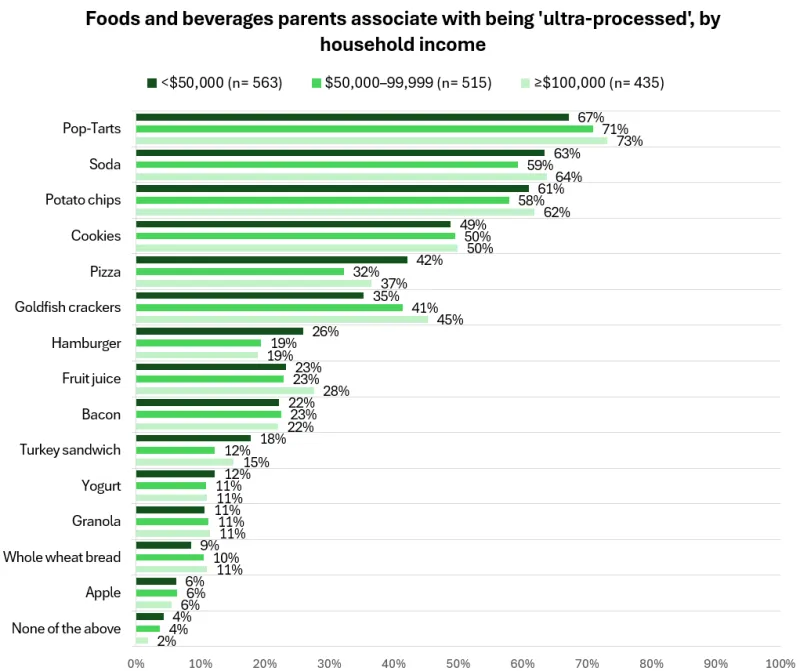
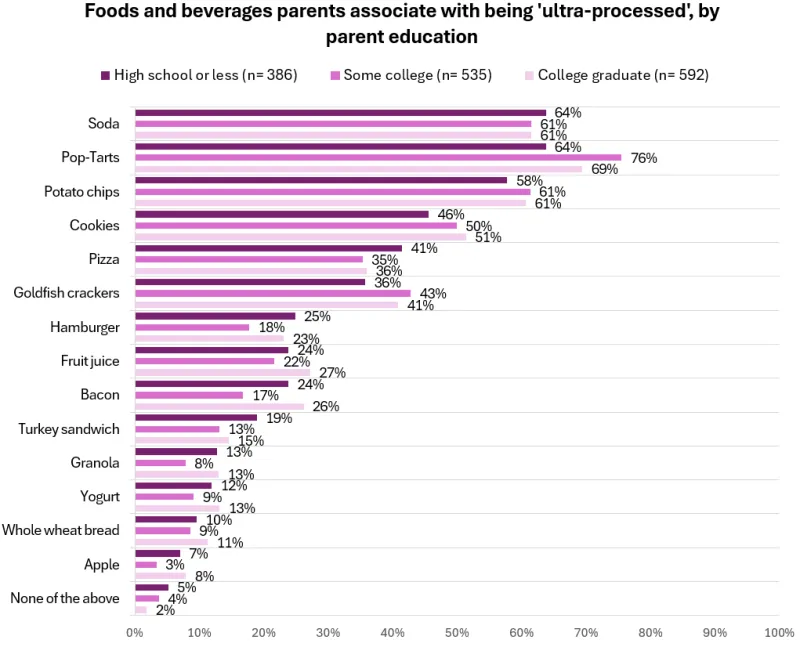
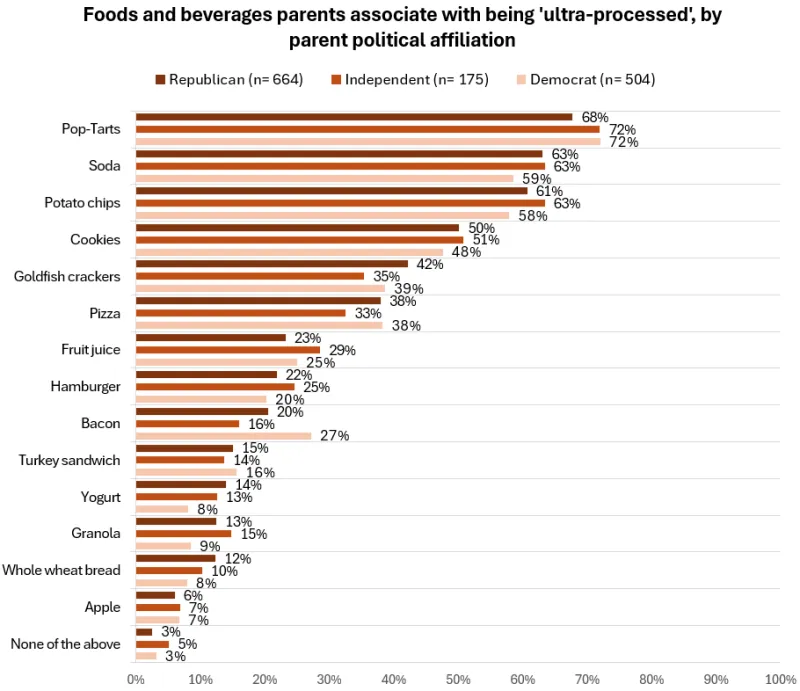
C10 Which of the following foods and beverages do you associate with being ‘ultra-processed’? [Select as many as apply for 01-14. Randomize 01-14]
1. Hamburger
2. Apple
3. Yogurt
4. Whole wheat bread
5. Potato chips
6. Pizza
7. Cookies
8. Soda
9. Fruit juice
10. Turkey sandwich
11. Granola
12. Bacon
13. Goldfish crackers
14. Pop-Tarts
15. None of the above [EXCLUSIVE]

C11 How much do you agree or disagree with the following statement?
All ultra-processed foods should be banned in the National School Lunch Program and School Breakfast Program. [Select one answer]
1. Strongly agree
2. Somewhat agree
3. Neither agree nor disagree
4. Somewhat disagree
5. Strongly disagree

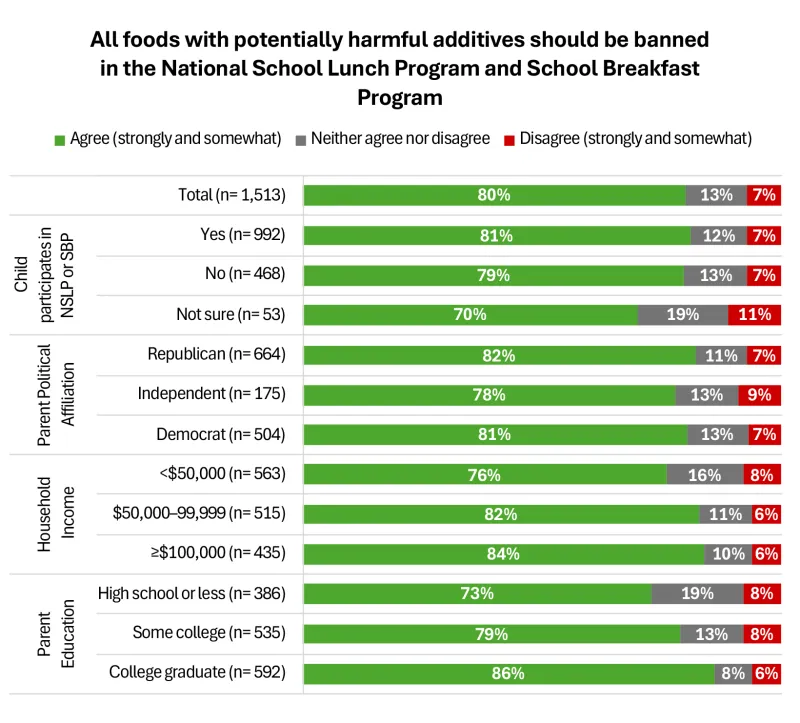
C12 How much do you agree or disagree with the following statement?
All foods with potentially harmful additives should be banned in the National School Lunch Program and School Breakfast Program. [Select one answer]
1. Strongly agree
2. Somewhat agree
3. Neither agree nor disagree
4. Somewhat disagree
5. Strongly disagree
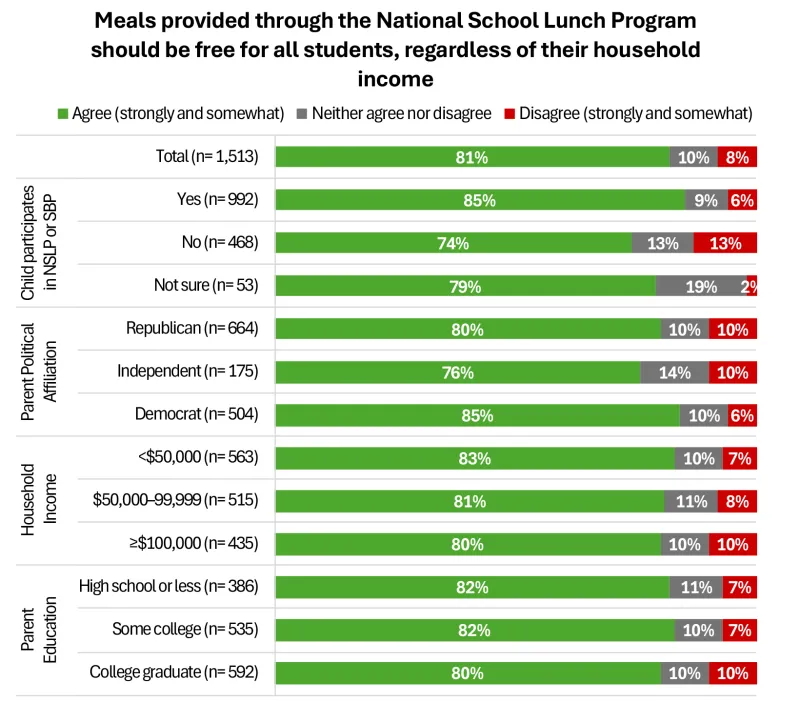
C13 How much do you agree or disagree with the following statement?
Meals provided through the National School Lunch Program should be free for all students, regardless of their household income. [Select one answer]
1. Strongly agree
2. Somewhat agree
3. Neither agree nor disagree
4. Somewhat disagree
5. Strongly disagree
For more information, please contact the Center for Science in the Public Interest at policy@cspi.org.